In this blog post, we’ll cover the steps to Install Grafana on CentOS 7 / RHEL 7 Linux system. Grafana v9 was recently released in with plenty of new features and is available for installation. Grafana is an open source tool which allows you to query, visualize and do alerting on your metrics no matter the backend data store.
For Ubuntu server, check:
New grafana features
- Library panels: Allow users to build panels that can be used in multiple dashboards
- Prometheus metrics browser: Allows you to quickly find metrics and select relevant labels to build basic queries.
- Grafana alerts: Centralizes alerting information for Grafana managed alerts and alerts from Prometheus-compatible data sources in one UI and API.
- Real-time streaming: Data sources can now send real-time updates to dashboards over a websocket connection
- Bar chart visualization: A new visualization that supports categorical data
- Histogram visualization: This hidden feature of the old Graph panel is now a standalone visualization
- State timeline visualization: The State timeline visualization shows discrete state changes over time
- Time series visualization out of Beta and is now graduating to a stable state
- Download logs: When you inspect a panel, you can now download log results as a text (.txt) file.
Step 1: Install Grafana on CentOS 7 / RHEL 7
Grafana 6 is now available for installation. Add Grafana RPM repository to your system.
sudo tee  /etc/yum.repos.d/grafana.repo<<EOF
[grafana]
name=grafana
baseurl=https://packages.grafana.com/oss/rpm
repo_gpgcheck=1
enabled=1
gpgcheck=1
gpgkey=https://packages.grafana.com/gpg.key
sslverify=1
sslcacert=/etc/pki/tls/certs/ca-bundle.crt
EOF
Once the repository is added, install grafana rpm package.
sudo yum -y install grafana
See more details about installed package.
$ rpm -qi grafana
Name        : grafana
Version     : 10.0.3
Release     : 1
Architecture: x86_64
Install Date: Fri 18 Aug 2023 10:36:02 PM UTC
Group       : default
Size        : 306233375
License     : AGPLv3
Signature   : RSA/SHA512, Tue 25 Jul 2023 06:02:03 PM UTC, Key ID 9e439b102cf3c0c6
Source RPM  : grafana-10.0.3-1.src.rpm
Build Date  : Tue 25 Jul 2023 06:01:26 PM UTC
Build Host  : d4f202c8a214
Relocations : /
Packager    : [email protected]
Vendor      : Grafana
URL         : https://grafana.com
Summary     : Grafana
....
Step 2: Start Grafana service on CentOS 7 / RHEL 7
After the installation of Grafana 8 on CentOS 7, the service can be started and enabled to start on system start using systemctl service management command:
sudo systemctl enable --now grafana-serverThe service should be in running state.
$ systemctl status grafana-server
● grafana-server.service - Grafana instance
   Loaded: loaded (/usr/lib/systemd/system/grafana-server.service; enabled; vendor preset: disabled)
   Active: active (running) since Fri 2023-08-18 22:36:32 UTC; 2s ago
     Docs: http://docs.grafana.org
 Main PID: 1844 (grafana)
   CGroup: /system.slice/grafana-server.service
           └─1844 /usr/share/grafana/bin/grafana server --config=/etc/grafana/grafana.ini --pidfile=/var/run/grafana/grafana-server.pid --packaging=rpm cfg:default.paths.logs=/var/log/grafana cfg...

Aug 18 22:36:32 cent7.mylab.io systemd[1]: Started Grafana instance.
Aug 18 22:36:32 cent7.mylab.io grafana[1844]: logger=modules t=2023-08-18T22:36:32.665133454Z level=warn msg="No modules registered..."
Aug 18 22:36:32 cent7.mylab.io grafana[1844]: logger=grafanaStorageLogger t=2023-08-18T22:36:32.667928064Z level=info msg="storage starting"
Aug 18 22:36:32 cent7.mylab.io grafana[1844]: logger=http.server t=2023-08-18T22:36:32.669629692Z level=info msg="HTTP Server Listen" address=[::]:3000 protocol=http subUrl= socket=
Aug 18 22:36:32 cent7.mylab.io grafana[1844]: logger=ngalert.state.manager t=2023-08-18T22:36:32.669869162Z level=info msg="Warming state cache for startup"
Aug 18 22:36:32 cent7.mylab.io grafana[1844]: logger=ngalert.state.manager t=2023-08-18T22:36:32.713560427Z level=info msg="State cache has been initialized" states=0 duration=43.686177ms
Aug 18 22:36:32 cent7.mylab.io grafana[1844]: logger=ticker t=2023-08-18T22:36:32.713763823Z level=info msg=starting first_tick=2023-08-18T22:36:40Z
Aug 18 22:36:32 cent7.mylab.io grafana[1844]: logger=ngalert.multiorg.alertmanager t=2023-08-18T22:36:32.713812219Z level=info msg="starting MultiOrg Alertmanager"
Aug 18 22:36:32 cent7.mylab.io grafana[1844]: logger=grafana.update.checker t=2023-08-18T22:36:32.729927816Z level=info msg="Update check succeeded" duration=40.943693ms
Aug 18 22:36:32 cent7.mylab.io grafana[1844]: logger=plugins.update.checker t=2023-08-18T22:36:32.766288956Z level=info msg="Update check succeeded" duration=76.959645ms
Step 3: Configure Firewall for Grafana
If you have an active firewalld service, ensure port 3000 is allowed.
sudo firewall-cmd --add-port=3000/tcp --permanent
sudo firewall-cmd --reload
Confirm the port is allowed in the firewalld.
$ firewall-cmd --list-all | grep 3000
ports: 3000/tcp
Step 4: Access Grafana UI on CentOS 7 / RHEL 7
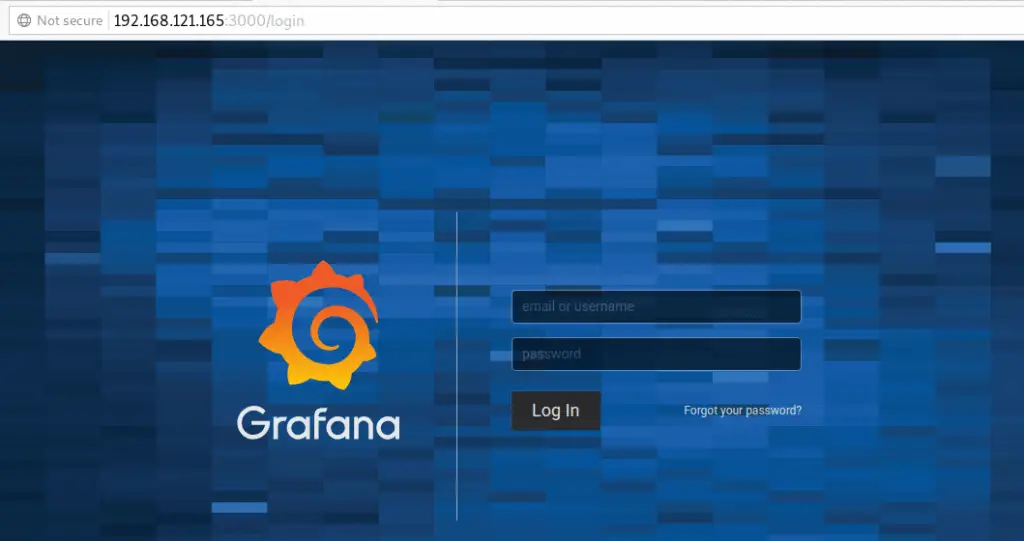
Once the service has been started, you can access its web dashboard by visiting http://[serverip|hostname]:3000.

The default login details are:
Username: admin
Password: admin
You’re asked to reset admin password after successful login. Provide a new password and confirm.

Grafana Package details:
- Installs binary to
/usr/sbin/grafana-server - Installs Init.d script to
/etc/init.d/grafana-server - Creates a default file (environment vars) to
/etc/sysconfig/grafana-server - Installs configuration file to
/etc/grafana/grafana.ini - Installs systemd service (if systemd is available) name
grafana-server.service - The default configuration sets the log file at
/var/log/grafana/grafana.log - The default configuration specifies a sqlite3 db at
/var/lib/grafana/grafana.db - Installs HTML/JS/CSS and other Grafana files at
/usr/share/grafana
Step 5: Adding Data Sources to Grafana
Grafana supports many different storage backends for your time series data. Each Data Source has a specific Query Editor that is customized for the features and capabilities that the particular Data Source exposes.
The following datasources are officially supported:
- Graphite
- Elasticsearch
- CloudWatch
- InfluxDB
- OpenTSDB
- Prometheus
- MySQL
- Postgres
- Microsoft SQL Server (MSSQL)
Step 6: Monitoring with Grafana
See our few guides on how you can monitor your infrastructure using Grafana and InfluxDB / Prometheus.
Monitor Linux System with Grafana and Telegraf
Monitoring Ceph Cluster with Prometheus and Grafana
How to Monitor BIND DNS server with Prometheus and Grafana
Monitoring MySQL / MariaDB with Prometheus in five minutes
How to Monitor Apache Web Server with Prometheus and Grafana in 5 minutes
Monitor Linux Server Performance with Prometheus and Grafana in 5 minutes
How to Monitor Redis Server with Prometheus and Grafana in 5 minutes
How to Monitor Apache Web Server with Prometheus and Grafana in 5 minutes
