
This article aims to give a better understanding of a very important technique of multivariate exploration. A correlation Matrix is basically a covariance matrix. Also known as the auto-covariance matrix, dispersion matrix, variance matrix, or variance-covariance matrix. It is a matrix in which the i-j position defines the correlation between the ith and jth parameter of the given data set. When the data points follow a roughly straight-line trend, the variables are said to have an approximately linear relationship. In some cases, the data points fall close to a straight line, but more often there is quite a bit of variability of the points around the straight-line trend. A summary measure called correlation describes the strength of the linear association.
Correlation in Python
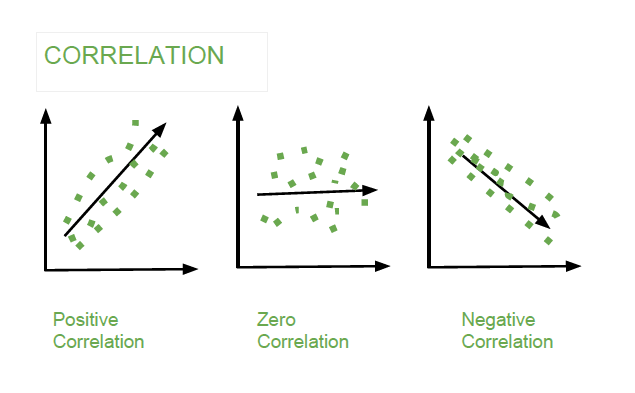
Correlation summarizes the strength and direction of the linear (straight-line) association between two quantitative variables. Denoted by r, it takes values between -1 and +1. A positive value for r indicates a positive association, and a negative value for r indicates a negative association. The closer r is to 1 the closer the data points fall to a straight line, thus, the linear association is stronger. The closer r is to 0, making the linear association weaker.
Correlation
Correlation is the statistical measure that defines to which extent two variables are linearly related to each other. In statistics, correlation is defined by the Pearson Correlation formula :

where,
- r: Correlation coefficient
 : i^th value first dataset X
 : Mean of first dataset X
 : i^th value second dataset Y
 : Mean of second dataset Y
 : i^th value first dataset X
 : Mean of first dataset X
 : i^th value second dataset Y
 : Mean of second dataset Y
Condition: The length of the dataset X and Y must be the same.
The Correlation value can be positive, negative, or zeros.
Correlation
Implementations with code:
Import the numpy library and define a custom dataset x and y of equal length:
Python3
# Import the numpy libraryimport numpy as np# Define the datasetx = np.array([1,3,5,7,8,9, 10, 15])y = np.array([10, 20, 30, 40, 50, 60, 70, 80]) |
Define the correlation by applying the above formula:
Python3
def Pearson_correlation(X,Y): if len(X)==len(Y): Sum_xy = sum((X-X.mean())*(Y-Y.mean())) Sum_x_squared = sum((X-X.mean())**2) Sum_y_squared = sum((Y-Y.mean())**2) corr = Sum_xy / np.sqrt(Sum_x_squared * Sum_y_squared) return corr print(Pearson_correlation(x,y)) print(Pearson_correlation(x,x)) |
Output:
0.974894414261588
1.0
The above output shows that the relationship between x and y is 0.974894414261588 and x and x is 1.0
We can also find the correlation by using the numpy corrcoef function.
Python3
print(np.corrcoef(x, y)) |
Output:
[[ 1.         -0.97489441]
 [-0.97489441  1.        ]]
The above output shows the correlations between x&x, x&y, y&x, and y&y.
Example
Import the necessary libraries
Python3
import pandas as pdfrom sklearn.datasets import load_diabetesimport seaborn as snsimport matplotlib.pyplot as plt |
Loading load_diabetes Data from sklearn.dataset
Python3
# Load the dataset with framedf = load_diabetes(as_frame=True)# conver into pandas dataframedf = df.frame# Print first 5 rowsdf.head() |
Output:
| age | sex | bmi | bp | s1 | s2 | s3 | s4 | s5 | s6 | target |
|---|---|---|---|---|---|---|---|---|---|---|
| 0 | 0.038076 | 0.050680 | 0.061696 | 0.021872 | -0.044223 | -0.034821 | -0.043401 | -0.002592 | 0.019907 | -0.017646 |
| 1 | -0.001882 | -0.044642 | -0.051474 | -0.026328 | -0.008449 | -0.019163 | 0.074412 | -0.039493 | -0.068332 | -0.092204 |
| 2 | 0.085299 | 0.050680 | 0.044451 | -0.005670 | -0.045599 | -0.034194 | -0.032356 | -0.002592 | 0.002861 | -0.025930 |
| 3 | -0.089063 | -0.044642 | -0.011595 | -0.036656 | 0.012191 | 0.024991 | -0.036038 | 0.034309 | 0.022688 | -0.009362 |
| 4 | 0.005383 | -0.044642 | -0.036385 | 0.021872 | 0.003935 | 0.015596 | 0.008142 | -0.002592 | -0.031988 | -0.046641 |
Find the Pearson correlations matrix by using the pandas command df.corr()
Syntax
df.corr(method, min_periods,numeric_only )

method : In method we can choose any one from {'pearson', 'kendall', 'spearman'} pearson is the standard correlation coefficient matrix i.e default
min_periods : int This is optional. Defines th eminimum number of observations required per pair.
numeric_only : Default is False, Defines we want to compare only numeric or categorical object also
Python3
# Find the pearson correlations matrixcorr = df.corr(method = 'pearson')corr |
Output:
| age | sex | bmi | bp | s1 | s2 | s3 | s4 | s5 | s6 | target | |
| age | 1.000000 | 0.173737 | 0.185085 | 0.335428 | 0.260061 | 0.219243 | -0.075181 | 0.203841 | 0.270774 | 0.301731 | 0.187889 |
| sex | 0.173737 | 1.000000 | 0.088161 | 0.241010 | 0.035277 | 0.142637 | -0.379090 | 0.332115 | 0.149916 | 0.208133 | 0.043062 |
| bmi | 0.185085 | 0.088161 | 1.000000 | 0.395411 | 0.249777 | 0.261170 | -0.366811 | 0.413807 | 0.446157 | 0.388680 | 0.586450 |
| bp | 0.335428 | 0.241010 | 0.395411 | 1.000000 | 0.242464 | 0.185548 | -0.178762 | 0.257650 | 0.393480 | 0.390430 | 0.441482 |
| s1 | 0.260061 | 0.035277 | 0.249777 | 0.242464 | 1.000000 | 0.896663 | 0.051519 | 0.542207 | 0.515503 | 0.325717 | 0.212022 |
| s2 | 0.219243 | 0.142637 | 0.261170 | 0.185548 | 0.896663 | 1.000000 | -0.196455 | 0.659817 | 0.318357 | 0.290600 | 0.174054 |
| s3 | -0.075181 | -0.379090 | -0.366811 | -0.178762 | 0.051519 | -0.196455 | 1.000000 | -0.738493 | -0.398577 | -0.273697 | -0.394789 |
| s4 | 0.203841 | 0.332115 | 0.413807 | 0.257650 | 0.542207 | 0.659817 | -0.738493 | 1.000000 | 0.617859 | 0.417212 | 0.430453 |
| s5 | 0.270774 | 0.149916 | 0.446157 | 0.393480 | 0.515503 | 0.318357 | -0.398577 | 0.617859 | 1.000000 | 0.464669 | 0.565883 |
| s6 | 0.301731 | 0.208133 | 0.388680 | 0.390430 | 0.325717 | 0.290600 | -0.273697 | 0.417212 | 0.464669 | 1.000000 | 0.382483 |
| target | 0.187889 | 0.043062 | 0.586450 | 0.441482 | 0.212022 | 0.174054 | -0.394789 | 0.430453 | 0.565883 | 0.382483 | 1.000000 |
The above table represents the correlations between each column of the data frame. The correlation between the self is 1.0, The negative correlation defined negative relationship means on increasing one column value second will decrease and vice-versa. The zeros correlation defines no relationship I.e neutral. and positive correlations define positive relationships meaning on increasing one column value second will also increase and vice-versa.
We can also find the correlations using numpy between two columns
Python3
# correaltions between age and sex columnsc = np.corrcoef(df['age'],df['sex'])print('Correlations between age and sex\n',c) |
Output:
Correlations between Age and Sex
 [[1.        0.1737371]
 [0.1737371 1.       ]]
We can match from the above correlation matrix table, it is almost the same result.
Plot the correlation matrix with the seaborn heatmap
Python3
plt.figure(figsize=(10,8), dpi =500)sns.heatmap(corr,annot=True,fmt=".2f", linewidth=.5)plt.show() |
Output:
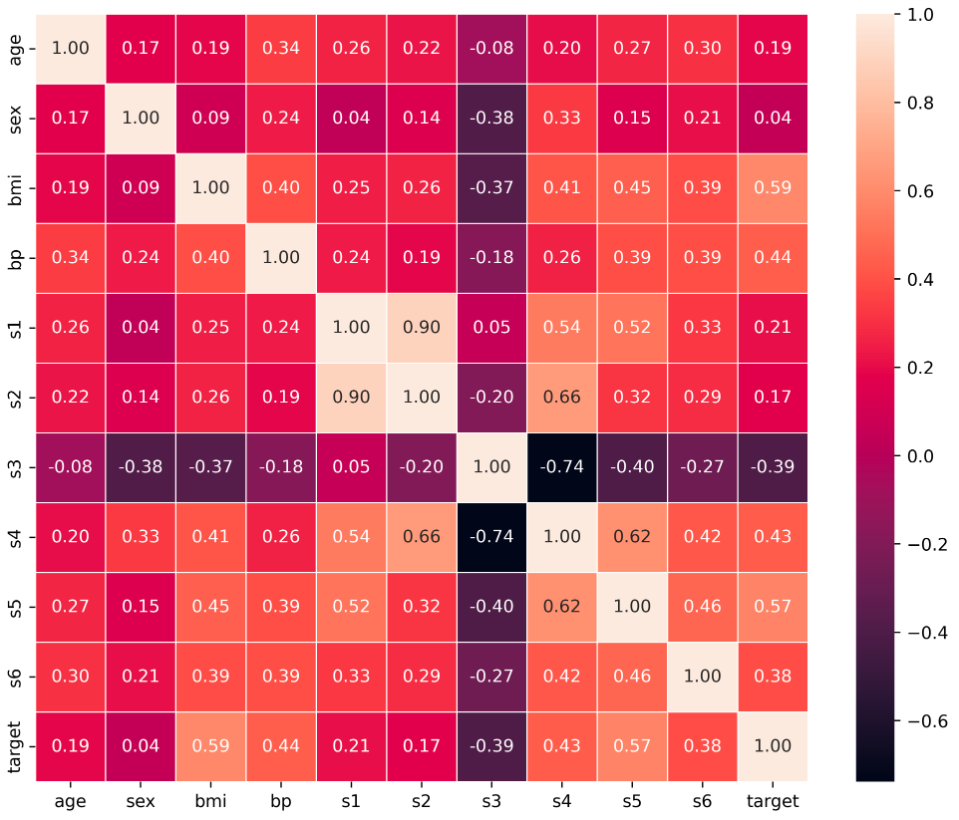
Correlations Matrix